If Robots Do All the Work, Who Gets Paid?
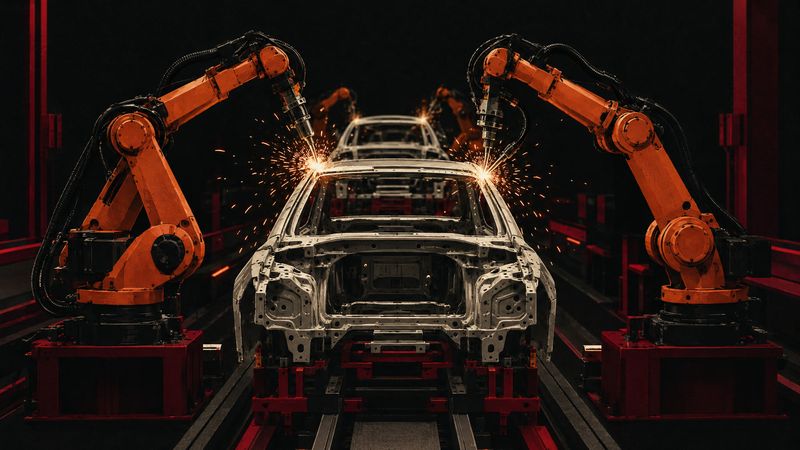
If machines do the work, who gets paid? Every economy has been built on whatever made wealth at the time. The record on jobs and pay, the arguments on both sides, and four answers to who owns the machines.

Makes the inspection and measurement machines that chipmakers use to find defects and control quality.
Coming soon
A closer look at KLA’s finances: what the figures reveal, the risks they show, and how the company’s promises compare with its results.
If machines do the work, who gets paid? Every economy has been built on whatever made wealth at the time. The record on jobs and pay, the arguments on both sides, and four answers to who owns the machines.
What actually happens inside an AI when you ask it a question, and how it learned to answer by guessing and being corrected.
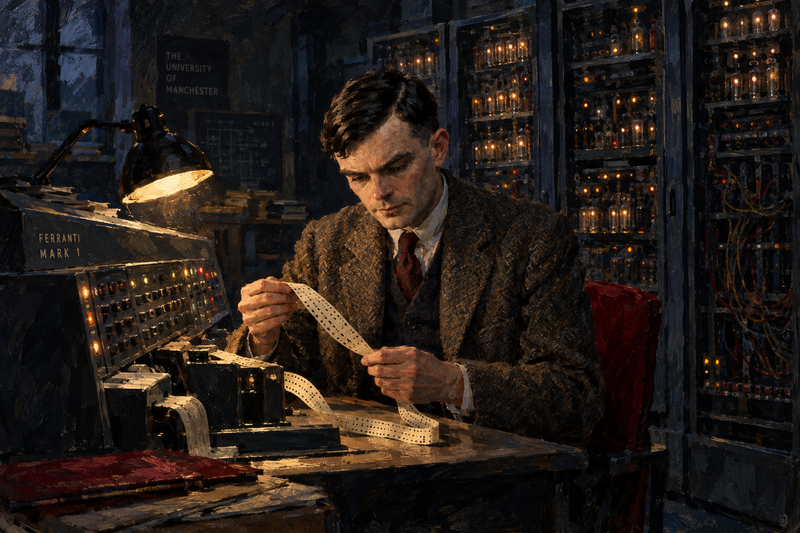
In 1950, Alan Turing asked whether machines could think. Today the question is who controls them.
Big Tech has doubled its spending on AI in a year, and this week investors wiped $500bn off Alphabet asking when it pays.
Councils, police and ministries took websites offline as a flaw in PHP, the web's most common server language, leaked before its fix.
OpenAI says its model has resolved more than 100 open maths problems, so the question now is how fast humans can check them.
Charts and live prices are delayed, from TradingView. Market values use each company’s last trade on IEX at the previous close, times the shares in issue from its filings; company figures come from SEC filings. This is information, not investment advice. Where our market data comes from
Company logos are trademarks of their owners, shown only to identify them; the files are from Wikimedia Commons.
Data provided for free by IEX. By accessing or using IEX Historical Data, you agree to the IEX Historical Data Terms of Use.